Insight
Exploring the role of emotions toward balance and well-being: The Maker’s Sprint at the DSS
Our inaugural project within the Digital Twin track of the Digital Society School (DSS) seeks to explore:
How can data driven insights from digital twins empower Paralympians to find and maintain balance?
A digital twin is a virtual representation of an object, a person, or a process. Creating digital twins requires accumulating and analyzing large sets of data. They provide a model that can help predict future behavior. It is this technology that we will explore in our design challenge.
The Digital Society School gives us the opportunity and space to use technology for the benefit of society by considering Sustainable Development Goals established by the UN. With our project, we focus on the following goals:
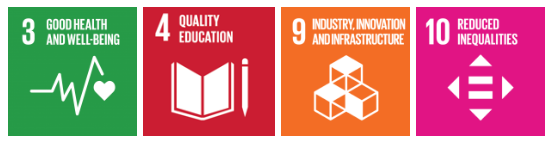
In the next five months, we will create a proof of concept to help Paralympians to find and maintain balance between their sports career, personal life, school, work, and hobbies, as well as living with a disability. We will seek to support the personal well-being of Paralympians through exploring balance.
In this and consequent articles we would like to guide you through our journey at DSS to create something special and meaningful.
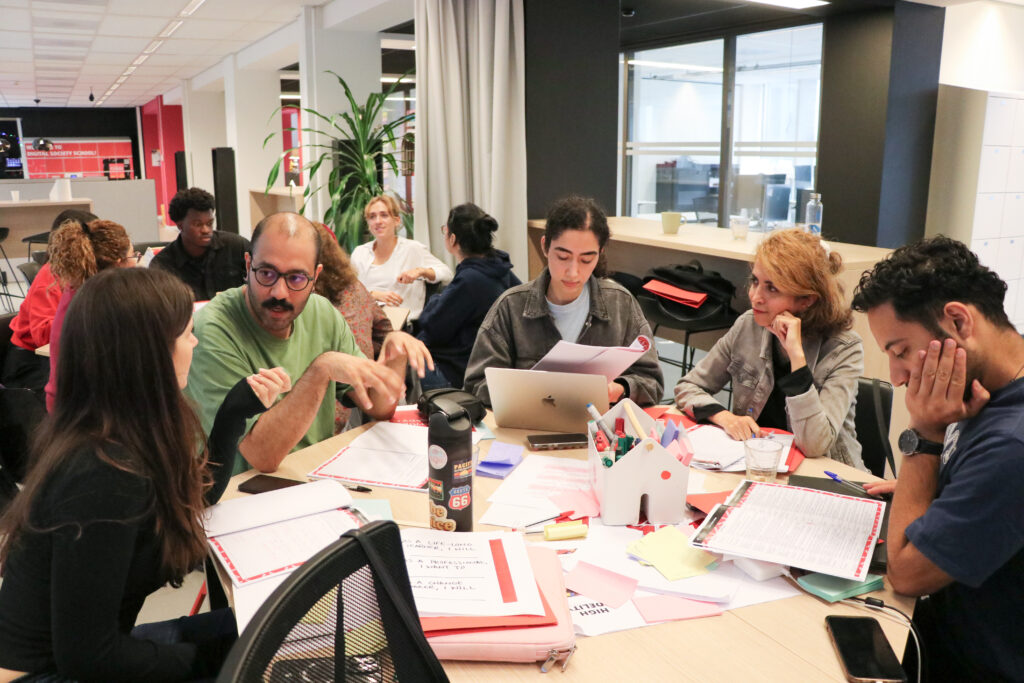
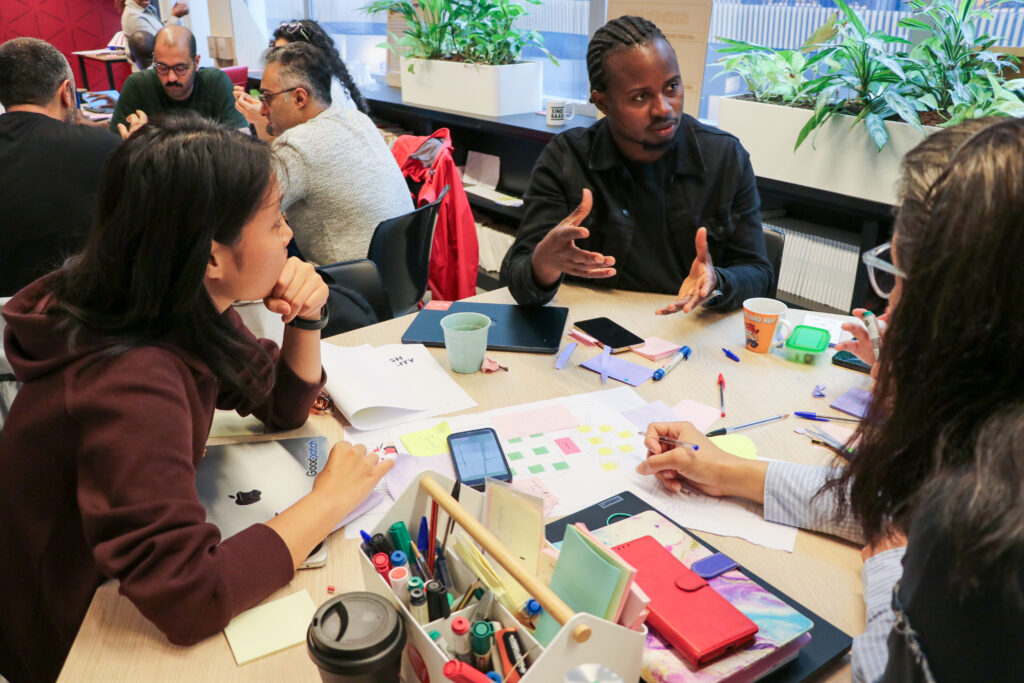
The Maker’s Sprint
The second week of our 20-week project was devoted to the Maker’s Sprint. The idea of this sprint is to create a conversational object in only one week, which would open an ideation process and conversation with our client and partners during our first meeting. It was a chance for us to explore different ideas and try to look at the components of our design challenge from new perspectives. To help us in this process, DSS offered us several workshops that introduced us to visual editing software, 3D-printing, prototyping, and creative coding.
The highlight of the week was meeting the main persona/case study of our project — Larissa. She is a visually impaired Dutch, Paralympic tandem cyclist and a student at the Hoogeschool van Amsterdam (HvA). She is an inspirational woman. She played an important role in our Makers’ Sprint and will remain at the center of our attention for the weeks to come. After this meeting we got a better insight into her life. We had the opportunity to talk with her about what’s important to her. We also understood better the relation between a sport and other facets of her life.

The role of emotions in achieving balance
We had the first big task in front of us. We had to create a conversational object and present it to our partners by the end of a week. The concept of balance became key to our brainstorming. We sought to explore the questions:
How can one seek balance?
What does it mean to reach balance?
From our previous discussion and research, we found that emotions can play an important role in balance. Our conversation with Larissa also assured us that exploring the role emotions play in achieving balance was a good direction.
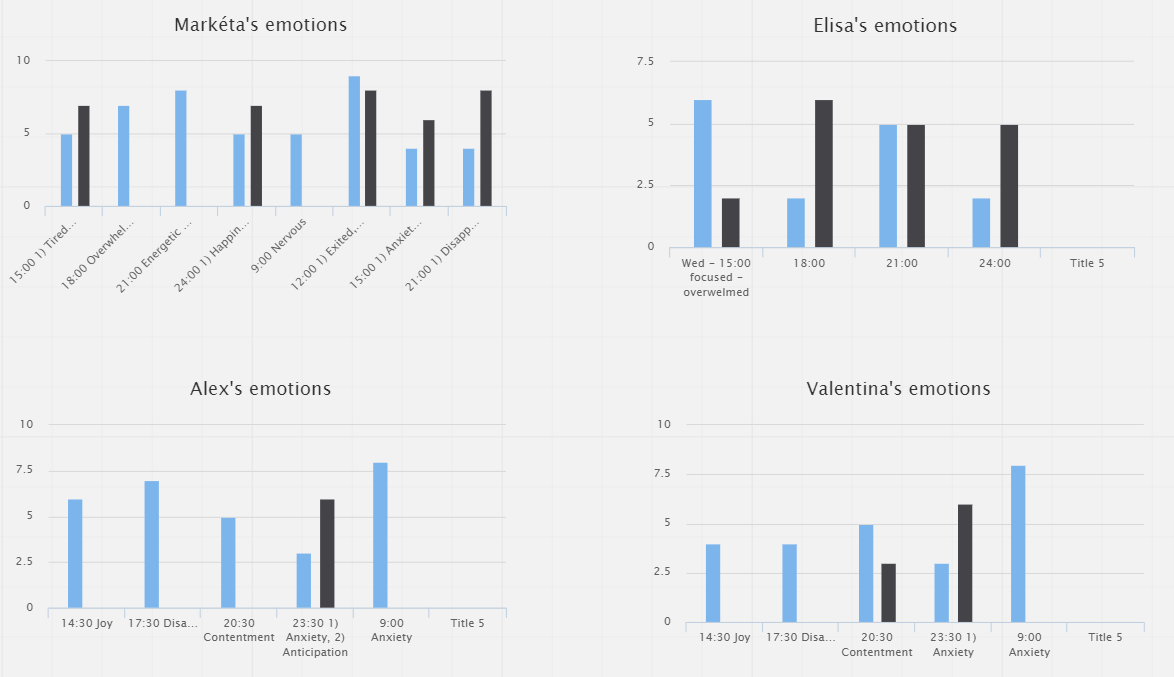
During the week, we tracked our emotional states through a simple self-tracking exercise. We set an alarm for every three hours during each day, and we documented our concrete emotions that we felt at each moment and its intensity.
Throughout the week, we experienced a range of different emotions. Sometimes they reached high arousal and intensity according to the situations we experienced during the sprint. In the beginning of the week we didn’t know each other, and we had learn to work as a team to create a prototype in a short period of time. We also had several intensive workshops focused on learning new skills. We also had to prepare to meet our partners. All these emotions are reflected in the graph below.
Our conversational object
After we collected some data, we were challenged with the idea of creating an accessible and inclusive visualization.
How could we visualize or physicalize data for a person with a sight impairment?
Our initial answer to this question, was to develop a 3D-printed graph, which could be experienced both with sight and touch. However, since we had to present our conversational object in an online environment, we started to look for a different solution.
Instead of printing a physical chart, we decided to create an online experience which could be explored as a 3D infographic and listened to in the form of sound.
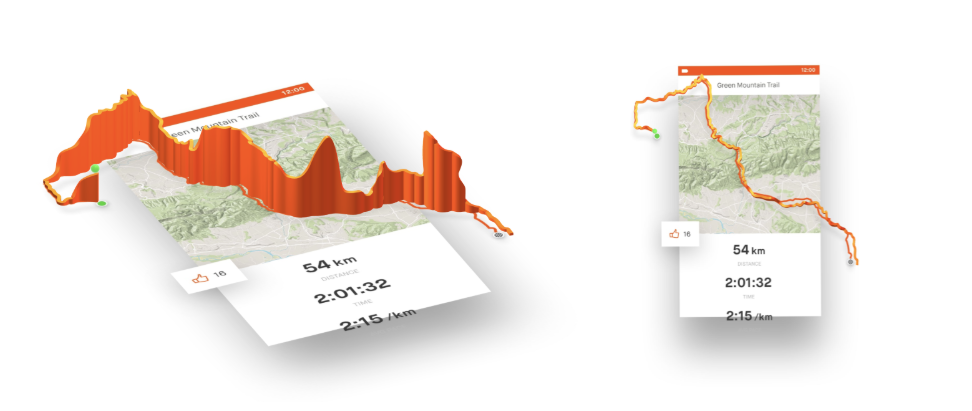
Our first step was to visualize our collected data. To do so, we united the charts above and turned them into a 3D graph. Highs and lows represent the intensity of our emotions throughout the week.
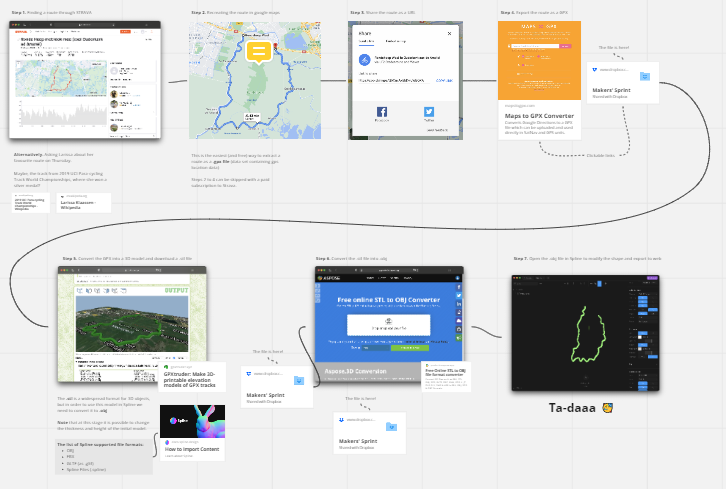
Then, we looked for a cycling route that we could superimpose this three-dimensional graph on as a nod to Larissa. This step required us to find a specific route from professional cycling and extract it as a GPX data set, containing X, Y, Z coordinates.
We took musical tracks from research by Eerola & Vuoskoski (2011). This research tried to combine music specific and general emotion models to evaluate emotions evoked by music (the Geneva Emotional Music Scale, the discrete and dimensional emotion models). In their pilot study, they took 110 film music excerpts of five discrete emotions (anger, fear, sadness, happiness and tenderness) of different valences, energy arousal, and tension arousal, and they let non-musicians evaluate these emotions. Based on this research, musical samples were selected to represent these five emotions in different strengths.
We selected musical samples according to this research which demonstrated our emotional journey during the day and mixed the music to this journey.

The result was an animated data visualization of our emotions, superimposed on a professional cycling competition route, accompanied with a soundtrack which reflects the emotions through music.
You can explore both the visual and audial parts of our conversational object on this page.
The Maker’s Sprint was very enriching for us. With the help of our coaches, we opened a fruitful conversation with our clients and had a conversation about the interplay between data, VR technology, athletic performance and the search for balance. We received a lot of interesting insights and ideas of possible directions of our next steps.
Stay tuned for more!
About our team
The Digital Twin team is composed of people with diverse backgrounds, experiences and cultures:
- Alexander — UX designer and media researcher from Russia.
(read more about him on his web page) - Elisa — UX designer focused in digital and exhibitions from Italy.
(explore her past projects in her portfolio) - Markéta — Master’s student in psychology from Czech Republic.
(find out more about her work in this page) - Valentina — Experience Designer & Researcher from Colombia.
(check out her previous works on her website)
But that’s not all! We also have our amazing coaches Mariana Pinheiro and Gaspard Bos who lead us through this process and help us think “out-of-the-box”. Finally, Shauna Jin is our track program manager, who guides us through the semester.
Our partners
In this project we have the opportunity to work with Streamingbuzz and Aionsports in collaboration with the Hogeschool van Amsterdam’s Elite Sport & Study program.

With their help we can explore augmented reality (AR), virtual reality (VR) and streaming technologies to make them more accessible and inclusive.
References
Eerola, T. & Vuoskoski, J. K. (2011). A comparison of the discrete and dimensional models of emotion in music. Psychology of Music, 39(1), 18–49. DOI: 10.1177/0305735610362821