Short Course
R and Visualisation for beginners
Want to get independent with visual making?
R is perfect to make quick prototyping. If you’re done with making visuals with Excel and want to get your visualisations one step further, keep reading.
R is a programming language that is relatively easy to learn, e.g., its code is more human readable and has a flexible syntax. It gives you access to a large set of libraries for all sort of purposes (e.g., visualisation, statistics, machine learning, web scraping, image processing, time series analysis and much more). With these libraries, complex tasks can be executed with a few lines of code.
Learning R will allow you to perform all sort of data processing tasks, with a faster learning curve and programming time than other alternatives like Python.
During this Digital Camp we will work on data sets that describe the green economy in The Netherlands.
WHAT YOU WILL LEARN
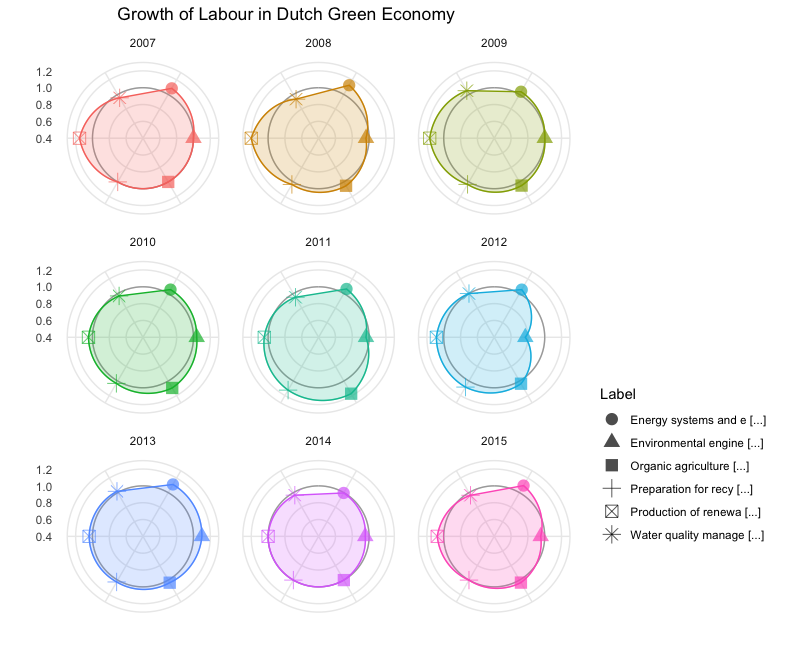
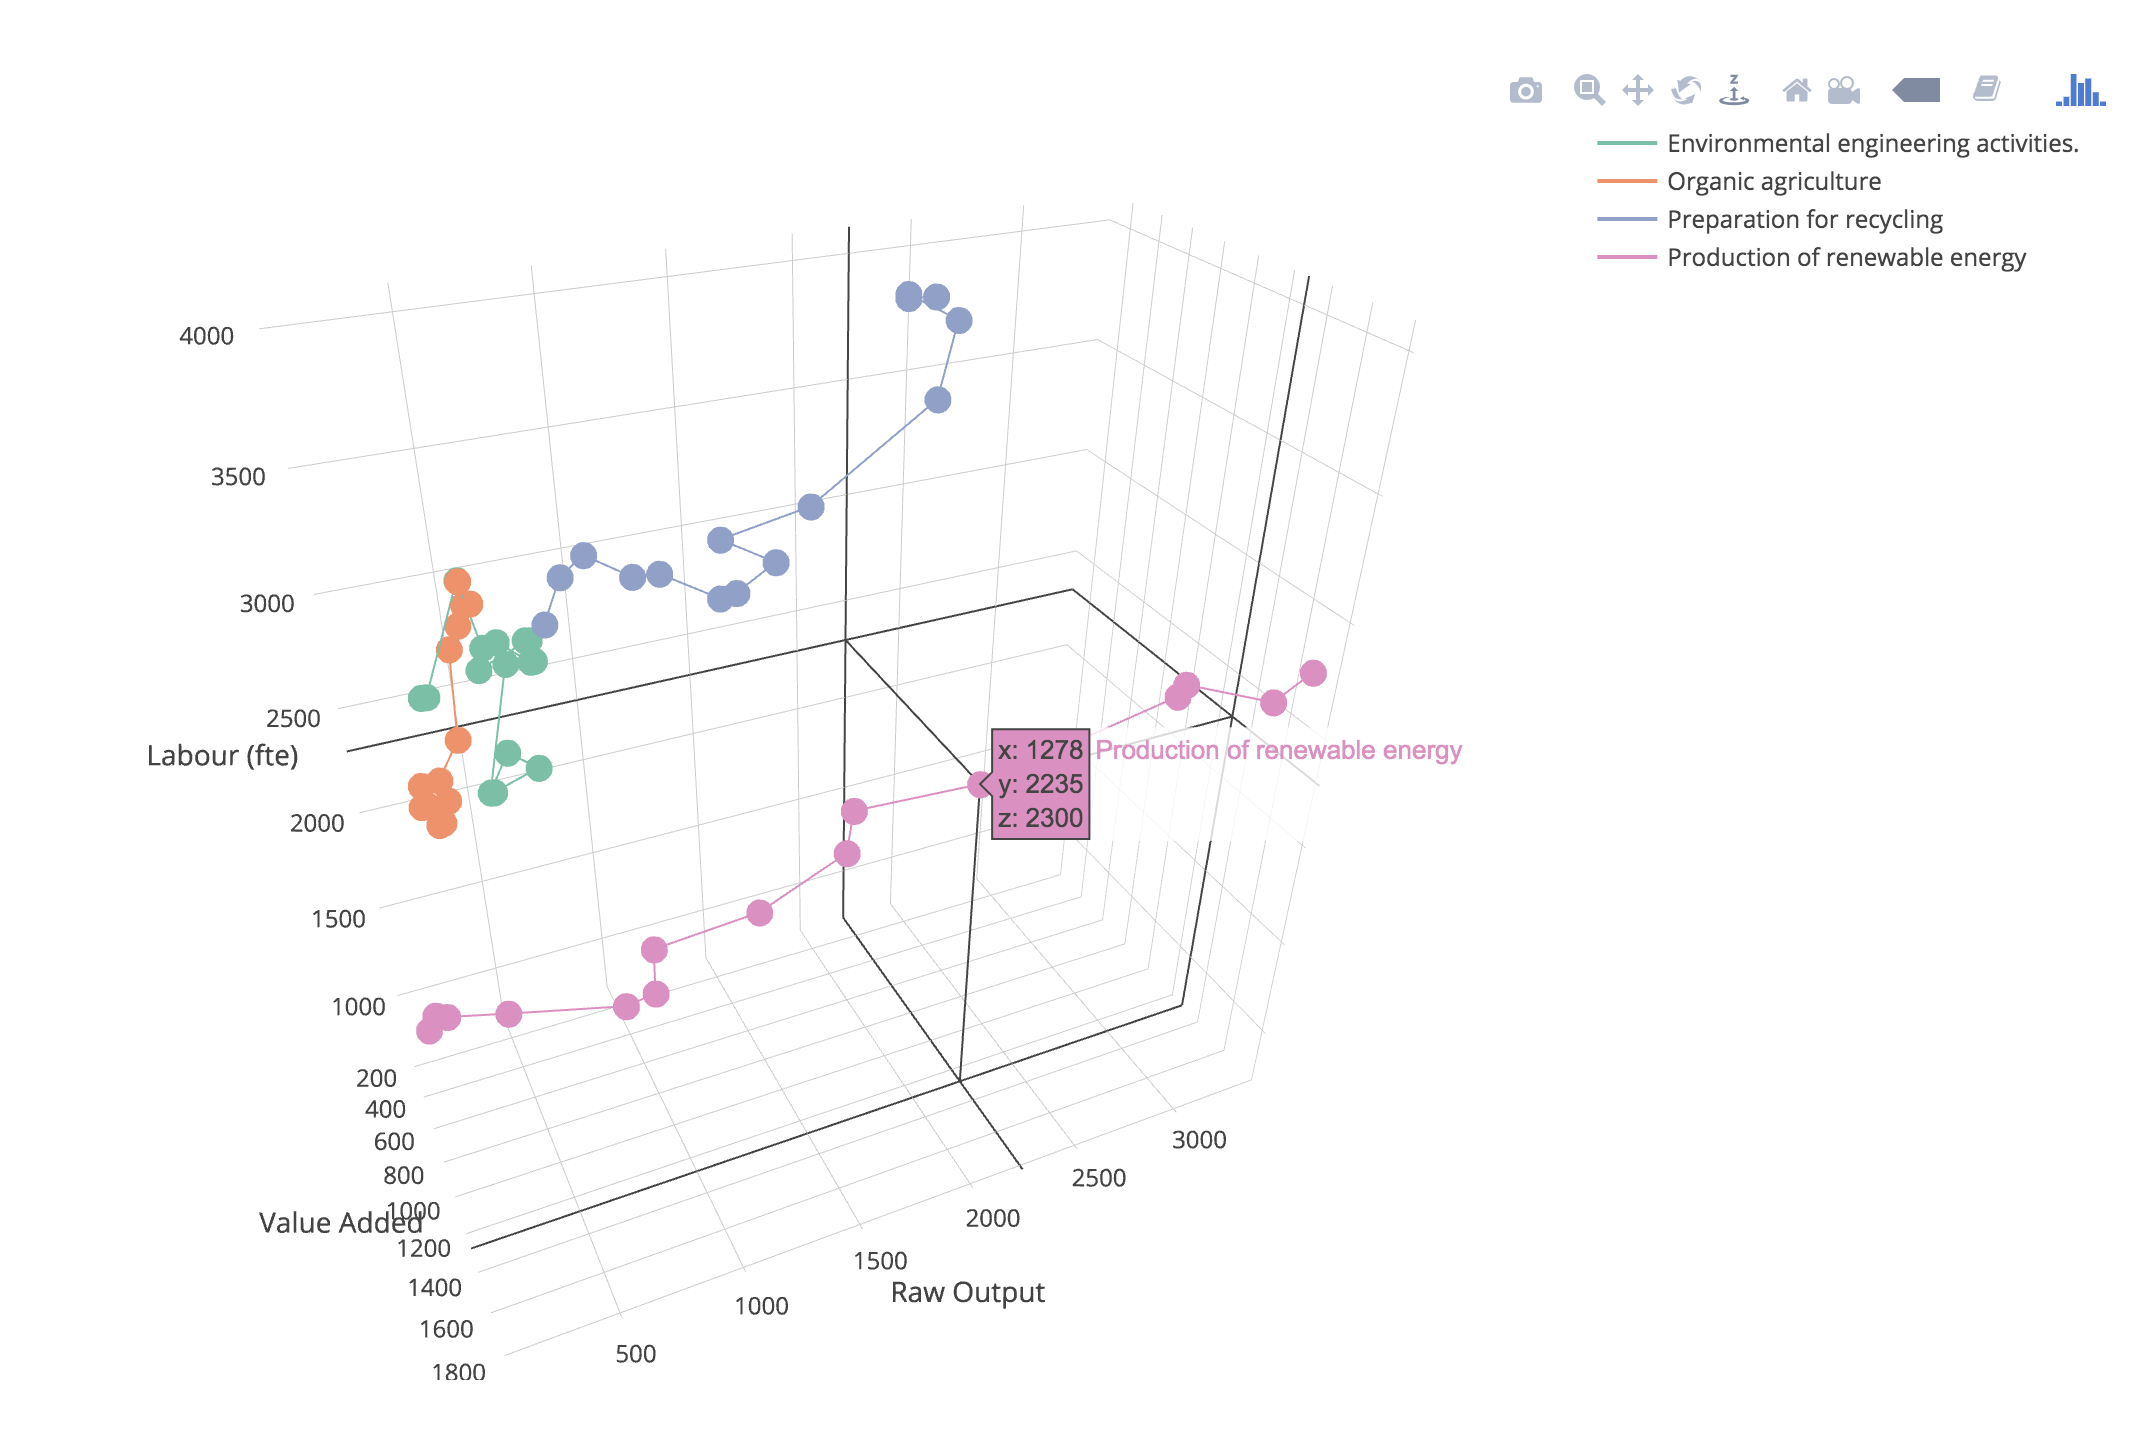
Visualisation made with R about the “Focus on the growth of labour for 6 sectors of activity.”
Day 1 – Thursday 3rd October 2019
Basics of Programming | 9:00 – 10:30
Learn the basic concepts and principles for programming.
Learners with programming experience will assist and collaborate with inexperienced learners during practice sessions.
The exercises will be designed so that all types of learners develop their programming skills.
Making R Code Easy | 10:30 – 12:30
Learn basic techniques to write fewer lines of code, and write code that is easy to inspect and correct.
Focusing on manipulating open source datasets, and performing basic tasks for collecting and preparing data (i.e., read, write, clean, format and merge datasets).
Lunch (provided) | 12:30 – 13:30
Basics of Visualisation | 13:30 – 17:00
Learn how to make basic visualisations with R, and how to think about the different options available to adapt visualisations to specific audiences (e.g., to choose the information, graph, and aesthetics).
Explore the datasets prepared in the morning.
Apply visualisations to overview the content of the data and report specific insights with attractive and intuitive visuals.
Day 2 – Friday 4th October 2019
Basics of Data Analysis | 9:00 – 12:30
Learn how to compute descriptive and comparative statistics, and when to use them.
Manipulate and investigate the datasets used in Day 1.
Apply visualisations to further investigate the patterns in the data and their statistical foundations.
Lunch (provided) | 12:30 – 13:30
Advanced Visualisation | 13:30 – 15:30
Learn about visualisations that are most effective (or attractive) for each data type.
The practices sessions will show how to implement these visualisations with R.
Interactive Visualisation | 15:45 – 17:00
Enhance visualisations, and their advantages and inconveniences.
Learn how to implement and export interactive visualisations with R.
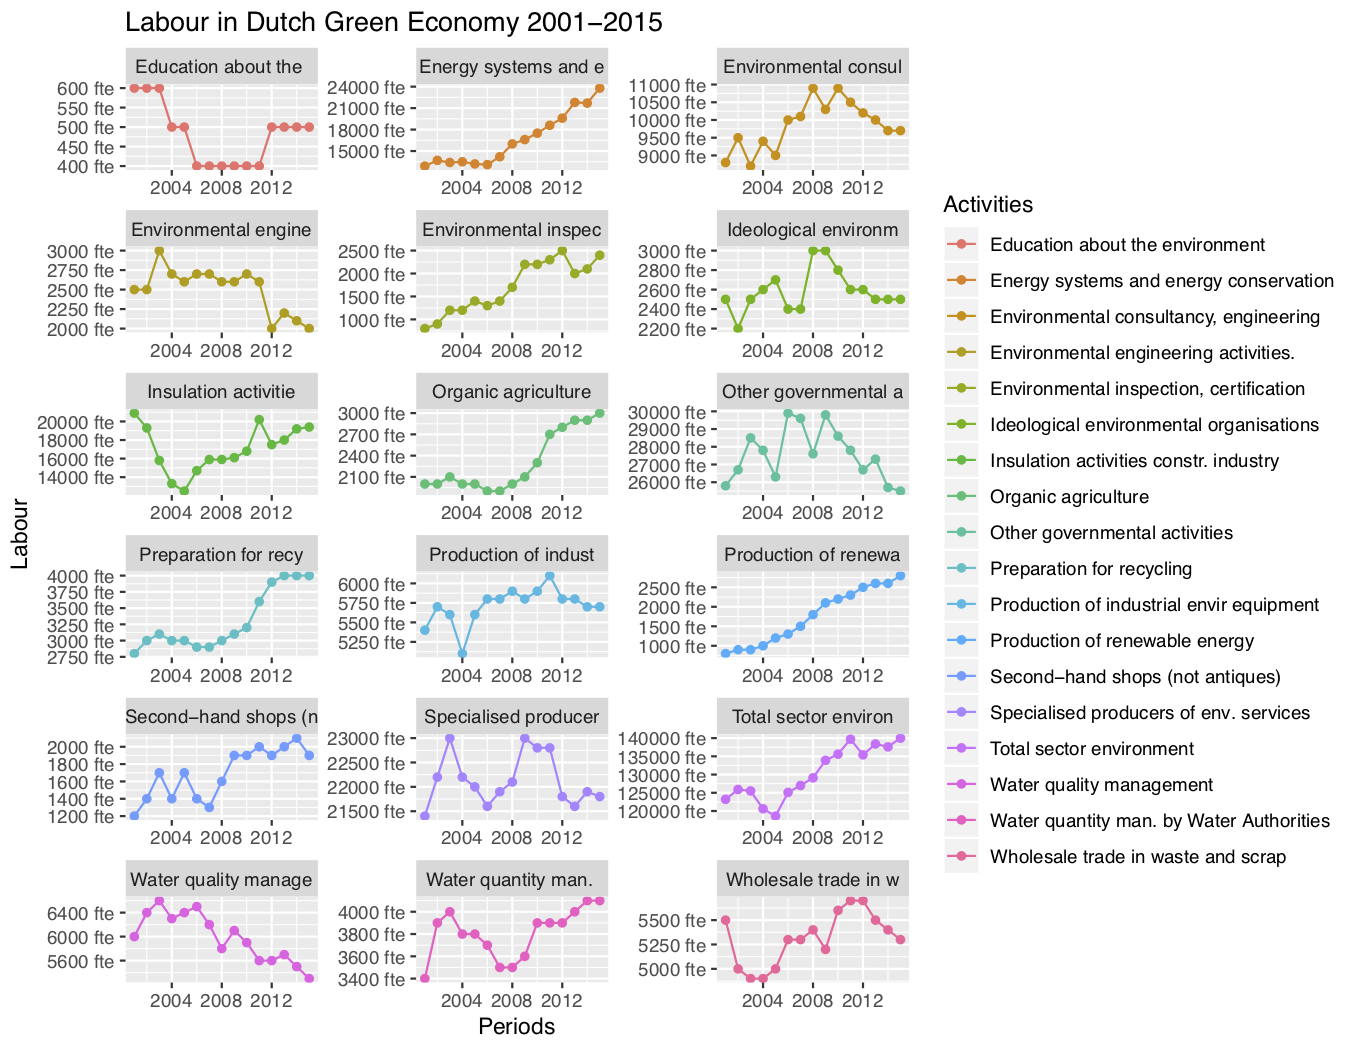
Basic line chart showing the evolution of employment in the Dutch green economy, for each sector of activity.
WHO IS THIS COURSE FOR?
R is easy and intuitive to learn. It is the most widely used and it is rising in popularity. The fact is, you have limited time. Learning a new programming language is a large time investment, so you need to be strategic about which one you select. Choose R. For us lifelong learning is an important part of our mission. To make sure that people acquire skills and tools that will be important for professional development.
No previous skills required…
Marketers
Researchers
Designers
Digital Consultants
Product Owners & their teams
Business Developers
Anyone interested in creating more insights in collected data
Practical information
Location: Urban Room, Studio HvA
Bring your own laptop with admin rights to install software
We are here to help you install the software half an hour before the start of the program
We can provide you an invoice after payment
Any other questions? Ask Margreet Riphagen.
Costs
This course is available at a student price of €50, €350 for full-time teachers and researchers, and €700 for professionals. The higher cost will apply to participants working within corporate training or consultancy, or those who work for training companies.
TRAINERS
 Emma Beauxis-Aussalet worked with R for 7 years, including 5 years for high academic research and 2 years as a programmer in a company for developing a web developing system with R for more than 100 data sources.
This Digital Camp is offered by the Data Driven Transformation track.