Online Course
Network Analysis with Gephi 20.05

Beginner course – no prior experience needed!
This short workshop (half a day) we will introduce you to the fundamentals on how to visualise networks, and take you through the entire process using a learning by doing approach. This means that you will work hands-on: combine a bit of theory with a practical case study.
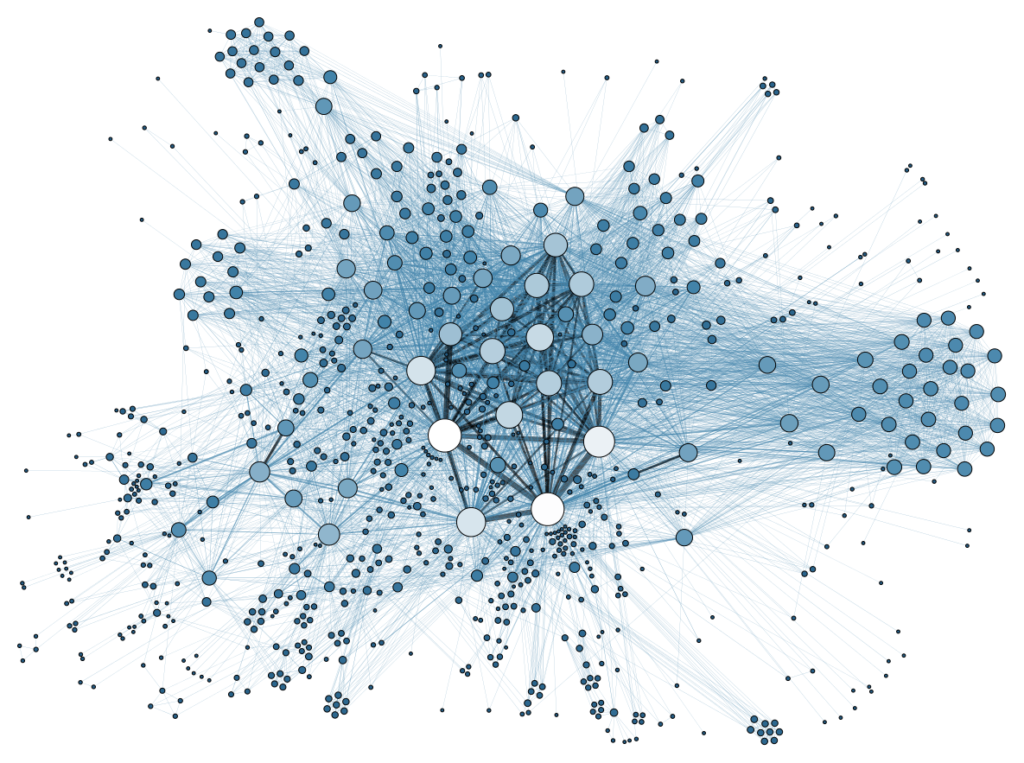
Network visualisation, link analysis or graph visualisation is the process of visually presenting networks of connected entities as nodes and links. Nodes represent data points and links represent the connections between them. To look beyond your flat data model and understand connections in your data and reveal hidden insights, you need powerful network visualisation tools, Gephi is such a tool. You’ll be introduced to the basics of this open-source network analysis, and visualisation software.
What you will learn
- Design a dataset for Gephi
- Import data into Gephi
- Apply variables to different visual features like colour and size
- Which layout algorithms are more useful to visualise different types of networks
- Statistically find communities in a network
- Choose the right filters to make the network more readable
- Principles on how to explore a network and make sense out of it
Covered DSS competencies
Interdisciplinary System Thinking
Collaboration and Co-creation
Create solutions for social impact

Whom is this course for?
You 👇:
This course is for anyone who is curious about data visualisation. More specifically for designers without programming experience interested in data visualisation, programmers who want to experiment with a data visualisation tool, researchers eager to explore their data in a visual way.
Questions you may have
Q: I am not a “designer”. Is this for me?
A: Yes most definitely! You don’t need any design expertise; this course is about creating the right mindset and conditions for innovation in general. Something that is important for every professional wanting to become future-proof!
Q: I am a “researcher”. Is this for me?
A: Yes. We will cover the basics to get everyone on the same page, but while doing that dive deeper into the designing and importing datasets and play around with those and along the way reveal insights.
Meet the expert

Carlo De Gaetano is an information designer and photographer, interested in visual content analysis, images as data and the mapping of social issues. He researches ways to re-purpose existing visual formats by experimenting with both digital and non-digital tools.